Monday, 15 February 2016

MSc Thesis

During my MSc Thesis, I did a research on the optimisation of Stormwater Best Management Practices (BMPs) implementation. Here is the abstract.
__________________________________________________________________________________________
Optimization of Implementing Best Management Practices (BMPs) in Urban Areas
Case Study in Surabaya City, Indonesia
Master Thesis by Badruz Zaman
Abstract
Runoff is the main source of urban flooding especially in the local drainage system. Urbanization, land use changes and climate changes are among the triggers that cause stormwater runoff increases. Conventionally problems of urban floods are solved by increasing the capacity of drainage networks in order to allow more stormwater runoff into the drainage system. However, this solution incurs high costs and not adaptable to the future uncertainties. US Environmental Protection Agency (USEPA) has promoted stormwater management in urban areas that more sustainable for future uncertainty which is called stormwater Best Management Practices (BMPs). The concept is utilizing the limited spaces in urban areas in mimicking predevelopment of hydrological site (natural condition). This research therefore aims to optimize the implementation of BMPs for retrofitting existing urban drainage network. Two conflicting objectives are solved in this research i.e. maximizing runoff reduction and minimizing BMP intervention costs. To evaluate the performance of BMP implementation, a case study in Puri Mas residential area of Surabaya in Indonesia has been developed. The final goal for this thesis is presenting optimal Pareto fronts of unit BMPs. This information is important for having a better decision making process.
The research is started by data collection and analysis. Rainfall data, subcatchment properties, and drainage networks are among data that have been analyzed. Those data are used to build a model of the drainage system in Puri Mas using SWMM 5.1. For implementing BMPs in the existing drainage system, 7 BMPs have been analyzed to see their feasibility to be implemented in the case study area. Finally, four BMPs have been selected and therefore detail design and costs estimation for each BMP are carried out. The selected BMPs are bio-retention cell, green roof, infiltration trench, and rain barrel. These BMPs then were applied in the existing drainage system of Puri Mas residential area. For optimizing the implementation of the BMPs, genetic algorithm based on NSGA-II was used to solve the multi-objective optimization. The result of optimization process is offset of solutions which indicate the areas implementation of BMPs.  With this information, it is expected that decision making process would be better.
Optimization process of implementation of BMPs in a case study area of Puri Mas has been performed and the result of the optimization process shows that BMP application has significantly reduced the peak flow. Within only occupied 15.43% of the total area, peak flow can be reduced by 27.74% which is from 130.20 litres per second to 94.08 litres per second with estimated costs of US$ 1.99 million. There are also varying solutions that are presented here to be chosen by decision makers. The results also showed that the optimized solutions provide valuable information for decision making process that commonly are not much easily identifiable by decision makers.

Keywords: runoff, stormwater, uncertainty, best management practices, hydrological, retrofitting, Pareto fronts, drainage networks, bio-retention cell, green roof, infiltration trench, rain barrel, genetic algorithm, NSGA-II, multi-objective obtimization, peak flow, decision making.   
______________________________________________________________________________
You caan download the MSc poster here and Full MSc Thesis Report here.

Friday, 12 February 2016

Lessons Learned from Flooding in West Sumatera

In January 2016, West Sumatera suffered a devastating flood that caused loss of life and massive damage to local properties. There are 10 Regencies that was badly affected by this flooding. The worst damaged areas were in Pasaman, Lima Puluh Kota and Solok Selatan Regencies. National Agency for Disaster Management (BNPB) has been identifying the flood damages. It was estimated that 1,003 homes hit by floods and 3,863 people are forcefully evacuated. Flash flood in Pasaman has destroyed 340 hectare of farmlands. In Sijunjung, 276 houses were submerged under the flood water and landslide has cut the only access way to Pekan Baru, Riau. Six person were reported died and one person is still missing after flood water swept him away. 400 houses were also badly damaged in Lima Puluh Kota. BNPB also pointed out that the flooding is not receded yet and even it gets wider spread in February 2016. Clean water, sanitation and food supply are the concerns of BNPB after the disaster.

Flooding in Lima Puluh Kota (Photo is courtesy of Sutopo, BNPB)

The Meteorological Department of Indonesia (BMKG) reported that rainfall in West Sumatera for January 2016 generally was categorized as normal rainfall (i.e. 101mm – 300mm). Only in Solok, Sijunjung, and Tanah Datar Regencies which reported has high rainfall (i.e. 401mm – 500mm). Normal rainfall was derived according to the rainfall data which have ranges of 85% to 115% from the average monthly rainfall over 30 years of recorded data. Director General of Water Resources said that the flash flooding happened in Padang is not due to high rainfall but it was caused by severe blocking of the river at the upstream areas. As proof, fallen trees, natural overgrowth, and rubbish were found in the river after flooding. Unfortunately, there is such a comprehensive study showing the main factors of the flooding. Local people in Solok Selatan informed that the flooding is the worst over 20 years. Batang Suliti and Batang Bangko Rivers in Lima Puluh Kota which were never overflowed over 40 years, it caused flooding in January 2016. From the information above, it can be summarized that the flood is not only caused by the high rainfall. There are other factors that probably as the main trigger of the floods happened. WALHI, an environmental organization in Indonesia said that flooding in West Sumatera is not due to climate factor only, it was also caused by environment damages.  Exploitation of natural resources have been tremendously occurred in West Sumatera. According to the data from Ministry of Energy and Mineral resources (ESDM), 262 mining and mineral exploration have been approved in 2015 for various commodities such as gold, bauxite, coper, calcite and coal. In Solok Selatan for example, it has area of 15,786 hectare for mining exploration purposes which certainly influences the infiltration rates. Subsequently, it leads to higher generated runoff. There are also illegal mining explorations along the river of Batanghari which now using heavy equipment in their operation. Besides that, palm oil plantation has become a major commodity in west Sumatera especially in Pasaman Barat.  This also contributed in changing the hydrological processes (runoff, soil moisture, and evapotranspiration). In the future, there will be more natural resources exploration as the government of west Sumatera currently has preparing 74 new contracts for mining exploration.

There are flood action plans that probably can be taken by the authorities to reduce floods in the future.

  1. Flood Risk Assessment is necessary to do.This will give information on which specific areas have higher risks of flooding and how much the damage cost is. Subsequently, it will help the authorities to determine priorities in action.
  2. Evaluation on permits for exploitation of natural resources. This includes the evaluation on the existing mining exploration and checking their operational procedures whether according to the environmental criteria or not. 
  3. Forestation. This is the way to restore the existing catchment as the deforestation activities massively occur.
  4. Improvement in river capacity and drainage system including the flood plain areas.
  5. Controlled flooding in specific areas where damage can be limited e.g. contructing dikes, detention ponds, weir dredging, etc.
  6. Flood forecasting. This is a good way to warn people about flooding and quick actions can be done by the authorities to minimize the impacts of flooding.
Finally, the most important factor in whatever actions that going to be taken is the awareness of government to put this issue as their first priority even pessimistically it would not happen.

Wednesday, 10 February 2016

Model Set-up and Result Analysis of HEC-RAS Model

HEC-RAS is a freeware developed by US Army Corp of Engineers. It can be used to build 1D/2D hydraulic modelling. In this article I am going to show you on how to build 1D model and analyze the results.


Model Set-Up
1D River Model has been developed based on the collected data as shown in Figure below:


Figure above shows the measured point data at the site. As you can see, the measured points still appear. However, the data is good enough especially in the river lines (see the green color). From this data, we extracted the sectional cross area of the river every 25 meter interval and slope for the longitudinal profile. And also we need this data to put as background in HEC-RAS model as we are going to digitize the background image. After you add background image, you are going to find something like this:
To make it easier when you start to digitize the river, I’ll suggest to divide the pictures based on your interested area. For my case, I divided into: river, center line, cross-section, layout plan in different colors as you can see above. For your information, HEC-RAS can support for figures as shape files, CAD files, TIF files, etc. You can choose whatever data you have. However, it is important to make sure that your background figures have been correctly projected.  This is important when you want to move your data and result to the other software such GIS, then it is going to be much easier.

After you have put the background pictures, the next step is digitizing the river and input the cross-section data as follows:
Steps:
  1. Add a new Cross Section from Options panel and then enter the river station name.
  2.  Fill in the station and elevation values for each stations.
  3. Data for Reach Length, Manning’s Values and Main Channel Bank stations are also need to be filled in.

After we have done with geometric data, then we can continue to fill the flow data. It depends on model that we set-up, for my case, I’ll simulate in unsteady flow. Open Edit panel and click Unsteady Flow Data...

Basically it will show you what kind of data that would you input on the upstream and downstream boundaries. There are several options there such as stage hydrograph, flow hydrograph, stage/flow hydrograph, rating curve or normal depth. For my case study, the input for the upstream boundary was determined by hydrological modelling using HEC-HMS. The result is flow hydrograph in meter cubic per second. For the input of the downstream boundary is normal depth which generated by friction slope. After this you can start running the model. Of course you still need to setup your time step and data management stuff.

Model Results
There are some options that can be used to show the results (see View panel). Let’s open DSS data …  and check the result. As my interest is the capacity of river in catering the rainfall design of 100 year return period therefore I’ll check the maximum elevation of the river whether it is beyond the existing river bank or not. 


You can see the animated result as shown above. The important part is the data that showing the maximum elevation at the river. It can been seen for 100 year flood design, it is higher that river bank even higher than reserve levels. I have also made simulation for 2 year flood design and it seems the river was originally designed for 2 year flood. Therefore improvement of the existing river is necessary as it makes flooding when the rainfall is higher than 2 year flood design statistically.


Modelling of Heat Water Spreading at Coastal Area

I have written a paper for the above title. Here is the abstract.
_________________________________________________________________________________
Abstract
Heat water disposal is inevitable in the cooling system of power plant in coastal environment. The effects of heat water that flows to coastal area can cause marine pollution disorders on the ecosystem balance because of its higher temperature. Thus it may be able to cause warm water recirculation into the intake point as the result of tidal current reversal. Appropriate design of cooling water layout need to be developed to prevent adverse effects on the environment and to minimize heat water spreading. In this research, heat water pollution from water cooling system of power plant was modelled using Surface Water Modelling System (SMS). The results of modelling are used as one of parameters in designing layout of inlet and outlet points of water cooling system. The model results show that different length of outlet canal provides different temperature rise spreading which also provide different results on the environmental and operational criteria.

Keywords: Power plant, marine pollution, thermal pollution, numerical modelling, SMS
_________________________________________________________________________________

You can download the full paper in this link.

Tuesday, 9 February 2016

Feasibility Study of Hydropower


Part 1:  Calculating the Potential of Hydropower

In order to know the potential of power that can be generated by a river, it can be calculated by the following equation:
Where:
   P    = potential of power (kW)
   ρ     = water density (1 kg/m3)
   g     = gravity acceleration (9.8 m/s2)
  Q     = river discharge (m3/second)
  h      = hross head (m)
So, when your client or government agencies asked you to calculate the potential of hydropower, you can simply use that formula as preliminary analysis.
If the river has a record of water levels, then it is a little bit easier to calculate. However, at the preliminary stage usually they don’t have any records. Therefore this can be done by visiting the site and take some measurement using current-meter. If you don’t have current-meter, then this method can be applied on how to find the discharge of the river:


  1.  Go to the site and find the location where the river morphology is straight, the flow is uniform, the slope is flat and the cross sectional area is almost the same (e.g. rectangular or trapezoid).
  2. Use a stick gauge to measure the dimension of river cross-section A to B.
  3. Find floating material such as wood chip, leaf, or anything can float and make sure your hand phone has installed stopwatch.
  4. Drop the float at point A and account the time until the float reach the point B.
  5. Repeat on the step 4 for several times.
Tabulate the record of river cross section data as follows:
Location
Width (m)
Water Depth (m)
Area (m)
A
x1
y1
z1
B
x2
y2
z2
Tabulate the time for the float flow as follows:
Distance Point A to Point B
d1 m
Measured Time
t1 second
t2 second
You can do more cross section measurement in between point A and B and time measurement if you like. Finally, use Manning Equation to calculate the flow:
Where:
   V     = average velocity (m/s)
   n      = friction coefficient (uniform linear stream: 0.028)
   R     = hydraulic radius: A / P
   A     = sectional area of flow (m2)
   P      = wetted perimeter (m)
   S      = slope (assumed 0.001 m/m for almost flat river)
River discharge (Q) is calculated by multiplying flow (V) and Sectional area of flow (A).
       
Q = V x A
Gross head is the height of water drop from the intake to the outlet. For hydropower that will be constructed using dam, it can be based on how much high the dam will be constructed. However, comprehensive analysis on hydrology and hydraulic must be carried out to know the exact water level. If the hydropower will constructed using run-of river scheme, it will be based on topographical level from intake to power house. Google Earth can be used to estimate the elevation roughly or the other available data (e.g. SRTM).
Finally, you can calculate the potential of hydropower that could be generated by river. Of course this is just a simple analysis when your client suddenly asked you at least this is what I have done. More detail analysis for sure need to be carried such as to find the effective generated power, detailed hydrology and hydraulic analysis, and layout plan design. 

Next to Part 2

Monday, 8 February 2016

About Me


Hi all, my name is Badruz Zaman originally from Kediri, Indonesia. Currently I am working with Witteveen Bos in Jakarta, Indonesia. Basically, My specialization in hydrology and hydraulic study and design.

I have completed my bachelor's degree in 2009 with specialization in Coastal Engineering from Institute Technology of Sepuluh Nopember Surabaya, Indonesia. During my last year project, I made thermal pollution spreading from a power plant in a coastal area. Besides that, I also did a physical modelling of outfall plume phenomena. After graduated, I worked in several places i.e. as a civil engineer at consultancy firm, lecturer at Ranaco Institute for training and education, and as researcher at TU-Braunchweig. The research is about Geotextile Sand Container (GSC) for natural coastal protection.


In 2015, I got my master's degree from UNESCO-IHE in Water Science and Engineering program, specialization in Hydroinformatics. Now, I am applying my knowledge as a water engineer in Indonesia. Some projects that I have been involving are flood mitigation studies, river realignment, feasibility study of hydropower and detailed design of drainage system, river improvement works and coastal protection. Those all experiences that I'll be sharing in this blog.

Basically, this Blog is dedicated to everyone who are interested in Water Science & Engineering especially modelling works. As my specialization in hydroinformatics, hence most of the posted articles are about water modelling.

Sharing with writing is important to ensure my brain keep working. The more we share, the more we get..!! Hopefully anyone who reads this Blog get some advantages.

If you are interested in doing research, here is my ResearchGate Link:
Badruz Zaman on ResearchGate


You can contact me via email: badruz.oe@gmail.com or drop messages in the comments if any something you want to discuss.

Monday, 1 February 2016

Inspection on hydraulic structures of Dam

Dam has a potential of dangers due to its impounding water. Failure on its structures can cause disaster in the downstream areas. It is important therefore to make sure that the structures in dam facilities are in good condition. Long operation of dam can cause the structures cracking, leaking, instable and ultimately failure. By routine inspection, it is expected that preliminary problems can be identified. Furthermore, necessary actions can be done to stop the propagation of its problems. One of the requirements that has to be done in dam operation is safety inspection. Usually it is required to be performed annually and will be reviewed every five years. Check this link for further detail information on dam safety procedure.

I have involved in annual dam safety inspection for hydraulic structural part. Therefore, I want to share here what kind of preparation that need to be done before inspection will be performed. Hydraulic structures in dam facilities can be vary depend on its function (water supply, hydropower, flood control, etc). It is important therefore to know what kind dam that will be inspected. The following are important information that need be known before the inspection:

1. Type of dam
2. Dimension of dam
3. Year of construction

In here, I'll only discuss about hydraulic structures. Of course there are other aspects that also need to be considered such as geology, geothecnics, electrical & mechanical, structure, hydrology, etc. Before conducting the inspection, potential problems on hydraulic structures can be identified from the characteristics of its flow. If the flow is calm or stagnant, probably there will be sedimentation problem while high flow can cause scouring, leaking and abrasion.

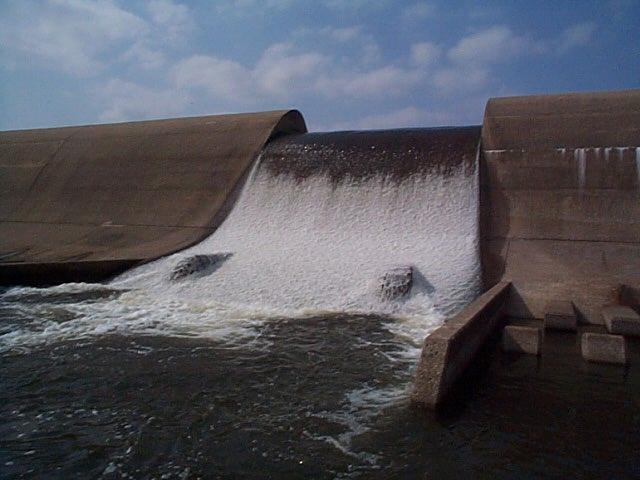
Generally hydraulic structures that exist in dam facilities are: spillway, tunnel outlet, stilling basin and tailing channel. Spillway is constructed to protect dam embankment during high water level. This structure has many type such as bellmouth, overfall, sidefall, etc. Bellmouth spillway usually exist in dam for water supply. As its name, the shape is likes bell mouth. When water level is high enough, it will flow to its mouth and goes to the tunnel. The following are pictures showing types of spillway.

Side Channel Spillway

Bell-mouth Spillway

Overfall Spillway

As you can see on the figures above, flow in the spillway is high. Abrasion, leaking and cavitation could happen on that structures. Inspection will only be done when the water level is not higher than the spillway structure. The most critical area of this structure is on the surface concrete. Probably white stains due to abrasion easy to find. Cracking also commonly happened on this structure.

The next hydraulic structure that need to be checked is tunnel. This structure is only available for spillway with bellmouth type.  For inspecting inside the tunnel, usually it requires safety permits for confined spaces. Therefore it should be prepared before the inspection will be conducted. Check the condition of surface tunnel especially in the joints and bottom where water drop occurred.

Water that flowing from spillway has high energy and it needs to be dissipated otherwise it can endanger the structure. The structure used for dissipating the water energy is Stilling Basin. The appear of this structure is like this:


You can see the baffle was designed to reduce the flow and also dissipate the energy of water. Subsequently, water flow and energy has reduced when it reaches the water body.

About Hydroinformatics


Hydroinformatics is one of branches in Water Science and Engineering. It focuses on solving water problems using Information, Computer and Technology (ICTs). As computer technology is getting more advance, relying on ICTs in solving water issues is inevitable.

Currently, there are many available software and models that have been developed to solve water issues such as HEC products from Army Corps of Engineering, USA, SWMM from USEPA, excel spreadsheet, etc. Besides its freeware, those software have also been used for many water-related projects around the world. Hence, everyone can have an access to use it and  take lessons from respective water projects. The specific topics i.e. Research, Opinion, Tutorials, and Forum were created to make anyone who interest on it can get benefits.

The knowledge of hydroinformatics can be used in many aspects of water management. For example during design stage of hydraulic structures. It is important to ensure the designed structures can withstand due to storm events. If we have two or more trade-off solutions for solving water problems, the optimization processes can be done to get the most optimal solutions.

The technology is evolving time to time. Unfortunately, not much of it has been applied in water sectors such as integrated modelling system, genetic algorithm, fuzzy logic, artificial intelligence (AI), model assimilation, real time control, etc. This is due to many aspects ultimately caused by un-awareness of stakeholders regarding these knowledge. It is important therefore to give a broader prospective to stakeholders/authorities on how to apply ICTs in water management.

Hydroinformatics is not a new knowledge in water-related study. However, the importance of this program is not so many people know. This Blog therefore is dedicated to spread the importance of Hydroinformatics in water management ultimately and as a place for sharing of my thought.