Showing posts with label Research. Show all posts

Thursday, 1 August 2019

Understanding Hydrological Procedure No. 4 and Its Application


I was privileged to give a training on "Understanding Hydrological Procedure No. 4 (2018) and Its Application" organised by Malaysia Water Partnership (MyWP) and UNESCO-IHP Malaysia. Hydrological Procedure No. 4 (HP 4) is a procedure to calculate peak floods in ungauged rural catchment of Malaysia. It was originally developed in 1974 and updated in 1987 covering only Peninsular Malaysia. In this update, the HP4 has considered all the hydrological data up to 2017 with covering areas include Peninsular Malaysia, Sarawak and Sabah. HP4 was developed using Regional Flood Frequency Analysis (RFFA) based on Index Flood Method. The assumption of this method is that the flood characteristics in a homogeneous region are similar in terms of its Mean Annual Flood (MAF) and Flood Frequency (FF). MAF formula was developed using multiple-linear regression with acceptance criteria R2 > 0.7 and PBIAS < 25%. For FF formula, it was developed using the goodness-of-fit test (Ztest) where a distribution is acceptable when Ztest < 3. The detailed formulas and its regions can be found on the HP4 manual in this Link. The most important things that I was highlighted during the training are: - All data used in this analysis has limitation (i.e. spatially, temporary and accuracy). - Every method (regression and statistics) has its own considerations and limitations. Finally, all models are wrong but some of them are useful. Hopefully, this hydrological procedure will be useful especially for young engineers and students.


Friday, 20 October 2017

Python

Programming languages are something important in our digital era nowadays. After I did a little research on what kind of programming languages that I should learn. The answer is PYTHON. Therefore, I dedicate a special page in my blog to discuss and elaborate about python on how we can master this programming language effectively.
The first question came into my mind is why Python? These are the reason why I choose Python:
1. Python is high level programming language. We don't need to make variables or argument declarations. It is straight-forward coding.
2. You don't have to do a coding from scratch. Some people certainly have developed it for you. What you have to do is revising it and update to suit your intention.

Ok, lets start with tools you need to have to run python. It depends on what kind of operating system you have, it will slightly difference the methodology. Most of programmers they prefer to use Linux which could be true. Myself use Linux, it is usually I am working using company PC which is not allow to install any softwre without permission from IT department. Therefore, I installed Virtual Machine using Linux to explore Python.
1. Install Python
No need. Linux already bring along the python.
2. Environment
So, you have language (i.e. python) but you cannot use it until you have environment or place to understand the language. I use miniconda, the mini version of anaconda.

To install miniconda:
donwload the file from https://conda.io/miniconda.html
open your terminal and direct to download folder
cd donwload/ and install it


Tuesday, 17 October 2017

Regional Flood Frequency Analysis

Regional Flood Frequency Analysis (RFFA) is one of methods which commonly used to determine design floods in rural areas. The example of utilising this method is for designing water-related structures such bridges, regulators, and dams.
Probability Distribution of Annual Maximum Streamflow

Two major steps in creating RFFA are: (1) determine the homogeneity regions (2) produce a frequency curve. Both of these steps need statistical analysis specifically probability distributions.
Among many method of RFFA, Index Flood Method initiated by Darlymple (1960) is the famous one. He proposed that homogeneity region is based on recurrence interval of 10 years and probability distribution using EV 1 with method of moment (MOM). United States of Geological Survey (USGS) is also adopting this method in their standard procedures.

To do this analysis, the first step is collecting the data. The importance data needed are as follows:

1. Annual Peak Flow
Annual peak flow or Maximum Annual Flood (AMAX) usually can be collected from water authority. This is a peak daily discharge within a year. The data was derived from rating curves of water levels and flow measurement. It is important therefore to check the raw data and plot them together so we can get the sense of the quality of the data.

The data must be random and independent. If the peak discharges are getting higher and higher over the years. This is an indication that we cannot use this data. Probably due to rapid development or control structures have been built in the catchment area.

2. Annual Rainfall
Annual rainfall is a cumulative of rainfall within a year. Similar to flow data, the rainfall data should have not a trend over the years. If the data higher from time to time or vice verse then it cannot be used as it was not independent anymore.

3. Catchment Area
Catchment area is the most significant parameter in determining the peak flow. Other factors such as slope, altitute, may also contribute to rising flow significantly. However, adding more parameters which make formula much complicated and the results are significantly improved, it is better to take the simple one but still represent the reality.

Monday, 21 November 2016

Hydrology in Quran

وَجَعَلْنَا مِنَ الْمَاءِ كُلَّ شَيْءٍ حَيٍّ  (QS. Al Anbiya':30)
..... And we create every living things from water.....

Water is the main substance of our life. We maybe still survive by only drinking water without eating. But for sure, we going to die just eating without drinking in a week. Besides for drinking, we also need water in almost all of our activities. For examples: washing clothes, watering garden, as a source of food, for irrigation, energy, transportation, etc. Moreover, the astronaut when looking for a new planet, the first material need to look for is water. This is an indication that planet is alive. In detail, Allah also mentioned that every moving creatures were created from water.

              ۚ وَاللَّهُ خَلَقَ كُلَّ دَابَّةٍ مِنْ مَاءٍ ۖ فَمِنْهُمْ مَنْ يَمْشِي عَلَىٰ بَطْنِهِ وَمِنْهُمْ مَنْ يَمْشِي عَلَىٰ رِجْلَيْنِ وَمِنْهُمْ مَنْ يَمْشِي عَلَىٰ أَرْبَعٍ
                                                                                                يَخْلُقُ اللَّهُ مَا يَشَاءُ ۚ إِنَّ اللَّهَ عَلَىٰ كُلِّ شَيْءٍ قَدِيرٌ

"Allah has created every moving (living) creature from water. Some of them crawl on their bellies, some of them walk on two legs, and some of them walk on four legs.

Besides talk about water as the essence of living things, Al-Quran also mentioned water as 

On progress....


Wednesday, 3 August 2016

Uji Tarik Pada Struktur GSC (Karung Pasir)

Berikut ini adalah jurnal yang saya buat tentang uji tarik pada sturktur Geotextile Sand Container (GSCs) atau karung pasir untuk mengetahui pengaruh rasio pengisian pasir dan juga gaya gesek permukaan struktur GSC tersebut.

Donwload link.


Monday, 15 February 2016

MSc Thesis

During my MSc Thesis, I did a research on the optimisation of Stormwater Best Management Practices (BMPs) implementation. Here is the abstract.
__________________________________________________________________________________________
Optimization of Implementing Best Management Practices (BMPs) in Urban Areas
Case Study in Surabaya City, Indonesia
Master Thesis by Badruz Zaman
Abstract
Runoff is the main source of urban flooding especially in the local drainage system. Urbanization, land use changes and climate changes are among the triggers that cause stormwater runoff increases. Conventionally problems of urban floods are solved by increasing the capacity of drainage networks in order to allow more stormwater runoff into the drainage system. However, this solution incurs high costs and not adaptable to the future uncertainties. US Environmental Protection Agency (USEPA) has promoted stormwater management in urban areas that more sustainable for future uncertainty which is called stormwater Best Management Practices (BMPs). The concept is utilizing the limited spaces in urban areas in mimicking predevelopment of hydrological site (natural condition). This research therefore aims to optimize the implementation of BMPs for retrofitting existing urban drainage network. Two conflicting objectives are solved in this research i.e. maximizing runoff reduction and minimizing BMP intervention costs. To evaluate the performance of BMP implementation, a case study in Puri Mas residential area of Surabaya in Indonesia has been developed. The final goal for this thesis is presenting optimal Pareto fronts of unit BMPs. This information is important for having a better decision making process.
The research is started by data collection and analysis. Rainfall data, subcatchment properties, and drainage networks are among data that have been analyzed. Those data are used to build a model of the drainage system in Puri Mas using SWMM 5.1. For implementing BMPs in the existing drainage system, 7 BMPs have been analyzed to see their feasibility to be implemented in the case study area. Finally, four BMPs have been selected and therefore detail design and costs estimation for each BMP are carried out. The selected BMPs are bio-retention cell, green roof, infiltration trench, and rain barrel. These BMPs then were applied in the existing drainage system of Puri Mas residential area. For optimizing the implementation of the BMPs, genetic algorithm based on NSGA-II was used to solve the multi-objective optimization. The result of optimization process is offset of solutions which indicate the areas implementation of BMPs.  With this information, it is expected that decision making process would be better.
Optimization process of implementation of BMPs in a case study area of Puri Mas has been performed and the result of the optimization process shows that BMP application has significantly reduced the peak flow. Within only occupied 15.43% of the total area, peak flow can be reduced by 27.74% which is from 130.20 litres per second to 94.08 litres per second with estimated costs of US$ 1.99 million. There are also varying solutions that are presented here to be chosen by decision makers. The results also showed that the optimized solutions provide valuable information for decision making process that commonly are not much easily identifiable by decision makers.

Keywords: runoff, stormwater, uncertainty, best management practices, hydrological, retrofitting, Pareto fronts, drainage networks, bio-retention cell, green roof, infiltration trench, rain barrel, genetic algorithm, NSGA-II, multi-objective obtimization, peak flow, decision making.   
______________________________________________________________________________
You caan download the MSc poster here and Full MSc Thesis Report here.

Wednesday, 10 February 2016

Model Set-up and Result Analysis of HEC-RAS Model

HEC-RAS is a freeware developed by US Army Corp of Engineers. It can be used to build 1D/2D hydraulic modelling. In this article I am going to show you on how to build 1D model and analyze the results.


Model Set-Up
1D River Model has been developed based on the collected data as shown in Figure below:


Figure above shows the measured point data at the site. As you can see, the measured points still appear. However, the data is good enough especially in the river lines (see the green color). From this data, we extracted the sectional cross area of the river every 25 meter interval and slope for the longitudinal profile. And also we need this data to put as background in HEC-RAS model as we are going to digitize the background image. After you add background image, you are going to find something like this:
To make it easier when you start to digitize the river, I’ll suggest to divide the pictures based on your interested area. For my case, I divided into: river, center line, cross-section, layout plan in different colors as you can see above. For your information, HEC-RAS can support for figures as shape files, CAD files, TIF files, etc. You can choose whatever data you have. However, it is important to make sure that your background figures have been correctly projected.  This is important when you want to move your data and result to the other software such GIS, then it is going to be much easier.

After you have put the background pictures, the next step is digitizing the river and input the cross-section data as follows:
Steps:
  1. Add a new Cross Section from Options panel and then enter the river station name.
  2.  Fill in the station and elevation values for each stations.
  3. Data for Reach Length, Manning’s Values and Main Channel Bank stations are also need to be filled in.

After we have done with geometric data, then we can continue to fill the flow data. It depends on model that we set-up, for my case, I’ll simulate in unsteady flow. Open Edit panel and click Unsteady Flow Data...

Basically it will show you what kind of data that would you input on the upstream and downstream boundaries. There are several options there such as stage hydrograph, flow hydrograph, stage/flow hydrograph, rating curve or normal depth. For my case study, the input for the upstream boundary was determined by hydrological modelling using HEC-HMS. The result is flow hydrograph in meter cubic per second. For the input of the downstream boundary is normal depth which generated by friction slope. After this you can start running the model. Of course you still need to setup your time step and data management stuff.

Model Results
There are some options that can be used to show the results (see View panel). Let’s open DSS data …  and check the result. As my interest is the capacity of river in catering the rainfall design of 100 year return period therefore I’ll check the maximum elevation of the river whether it is beyond the existing river bank or not. 


You can see the animated result as shown above. The important part is the data that showing the maximum elevation at the river. It can been seen for 100 year flood design, it is higher that river bank even higher than reserve levels. I have also made simulation for 2 year flood design and it seems the river was originally designed for 2 year flood. Therefore improvement of the existing river is necessary as it makes flooding when the rainfall is higher than 2 year flood design statistically.


Modelling of Heat Water Spreading at Coastal Area

I have written a paper for the above title. Here is the abstract.
_________________________________________________________________________________
Abstract
Heat water disposal is inevitable in the cooling system of power plant in coastal environment. The effects of heat water that flows to coastal area can cause marine pollution disorders on the ecosystem balance because of its higher temperature. Thus it may be able to cause warm water recirculation into the intake point as the result of tidal current reversal. Appropriate design of cooling water layout need to be developed to prevent adverse effects on the environment and to minimize heat water spreading. In this research, heat water pollution from water cooling system of power plant was modelled using Surface Water Modelling System (SMS). The results of modelling are used as one of parameters in designing layout of inlet and outlet points of water cooling system. The model results show that different length of outlet canal provides different temperature rise spreading which also provide different results on the environmental and operational criteria.

Keywords: Power plant, marine pollution, thermal pollution, numerical modelling, SMS
_________________________________________________________________________________

You can download the full paper in this link.

Tuesday, 9 February 2016

Feasibility Study of Hydropower


Part 1:  Calculating the Potential of Hydropower

In order to know the potential of power that can be generated by a river, it can be calculated by the following equation:
Where:
   P    = potential of power (kW)
   ρ     = water density (1 kg/m3)
   g     = gravity acceleration (9.8 m/s2)
  Q     = river discharge (m3/second)
  h      = hross head (m)
So, when your client or government agencies asked you to calculate the potential of hydropower, you can simply use that formula as preliminary analysis.
If the river has a record of water levels, then it is a little bit easier to calculate. However, at the preliminary stage usually they don’t have any records. Therefore this can be done by visiting the site and take some measurement using current-meter. If you don’t have current-meter, then this method can be applied on how to find the discharge of the river:


  1.  Go to the site and find the location where the river morphology is straight, the flow is uniform, the slope is flat and the cross sectional area is almost the same (e.g. rectangular or trapezoid).
  2. Use a stick gauge to measure the dimension of river cross-section A to B.
  3. Find floating material such as wood chip, leaf, or anything can float and make sure your hand phone has installed stopwatch.
  4. Drop the float at point A and account the time until the float reach the point B.
  5. Repeat on the step 4 for several times.
Tabulate the record of river cross section data as follows:
Location
Width (m)
Water Depth (m)
Area (m)
A
x1
y1
z1
B
x2
y2
z2
Tabulate the time for the float flow as follows:
Distance Point A to Point B
d1 m
Measured Time
t1 second
t2 second
You can do more cross section measurement in between point A and B and time measurement if you like. Finally, use Manning Equation to calculate the flow:
Where:
   V     = average velocity (m/s)
   n      = friction coefficient (uniform linear stream: 0.028)
   R     = hydraulic radius: A / P
   A     = sectional area of flow (m2)
   P      = wetted perimeter (m)
   S      = slope (assumed 0.001 m/m for almost flat river)
River discharge (Q) is calculated by multiplying flow (V) and Sectional area of flow (A).
       
Q = V x A
Gross head is the height of water drop from the intake to the outlet. For hydropower that will be constructed using dam, it can be based on how much high the dam will be constructed. However, comprehensive analysis on hydrology and hydraulic must be carried out to know the exact water level. If the hydropower will constructed using run-of river scheme, it will be based on topographical level from intake to power house. Google Earth can be used to estimate the elevation roughly or the other available data (e.g. SRTM).
Finally, you can calculate the potential of hydropower that could be generated by river. Of course this is just a simple analysis when your client suddenly asked you at least this is what I have done. More detail analysis for sure need to be carried such as to find the effective generated power, detailed hydrology and hydraulic analysis, and layout plan design. 

Next to Part 2

Monday, 1 February 2016

Inspection on hydraulic structures of Dam

Dam has a potential of dangers due to its impounding water. Failure on its structures can cause disaster in the downstream areas. It is important therefore to make sure that the structures in dam facilities are in good condition. Long operation of dam can cause the structures cracking, leaking, instable and ultimately failure. By routine inspection, it is expected that preliminary problems can be identified. Furthermore, necessary actions can be done to stop the propagation of its problems. One of the requirements that has to be done in dam operation is safety inspection. Usually it is required to be performed annually and will be reviewed every five years. Check this link for further detail information on dam safety procedure.

I have involved in annual dam safety inspection for hydraulic structural part. Therefore, I want to share here what kind of preparation that need to be done before inspection will be performed. Hydraulic structures in dam facilities can be vary depend on its function (water supply, hydropower, flood control, etc). It is important therefore to know what kind dam that will be inspected. The following are important information that need be known before the inspection:

1. Type of dam
2. Dimension of dam
3. Year of construction

In here, I'll only discuss about hydraulic structures. Of course there are other aspects that also need to be considered such as geology, geothecnics, electrical & mechanical, structure, hydrology, etc. Before conducting the inspection, potential problems on hydraulic structures can be identified from the characteristics of its flow. If the flow is calm or stagnant, probably there will be sedimentation problem while high flow can cause scouring, leaking and abrasion.

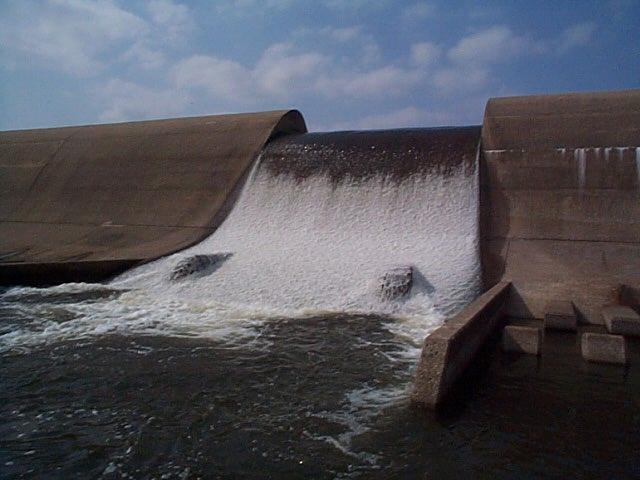
Generally hydraulic structures that exist in dam facilities are: spillway, tunnel outlet, stilling basin and tailing channel. Spillway is constructed to protect dam embankment during high water level. This structure has many type such as bellmouth, overfall, sidefall, etc. Bellmouth spillway usually exist in dam for water supply. As its name, the shape is likes bell mouth. When water level is high enough, it will flow to its mouth and goes to the tunnel. The following are pictures showing types of spillway.

Side Channel Spillway

Bell-mouth Spillway

Overfall Spillway

As you can see on the figures above, flow in the spillway is high. Abrasion, leaking and cavitation could happen on that structures. Inspection will only be done when the water level is not higher than the spillway structure. The most critical area of this structure is on the surface concrete. Probably white stains due to abrasion easy to find. Cracking also commonly happened on this structure.

The next hydraulic structure that need to be checked is tunnel. This structure is only available for spillway with bellmouth type.  For inspecting inside the tunnel, usually it requires safety permits for confined spaces. Therefore it should be prepared before the inspection will be conducted. Check the condition of surface tunnel especially in the joints and bottom where water drop occurred.

Water that flowing from spillway has high energy and it needs to be dissipated otherwise it can endanger the structure. The structure used for dissipating the water energy is Stilling Basin. The appear of this structure is like this:


You can see the baffle was designed to reduce the flow and also dissipate the energy of water. Subsequently, water flow and energy has reduced when it reaches the water body.